Red Stamp Media · A US university's Costa Rica campus
Where applicants get stuck, from the survey to the wireframes.
A US university's Costa Rica campus offers a US degree, earned in Costa Rica, for a fraction of the price, but its audience didn't know it. Through the agency Red Stamp Media, I ran the discovery for the redesign: a stakeholder session, a student survey, personas, user flows written as user stories, an experience map, a benchmark and a new information architecture, through to wireframes and handoff.
- Problem
- The curriculum sat three or four levels deep, costs were hidden or varied by degree, and applying felt like a maze.
- My role
- UX designer through Red Stamp Media: research, requirements, information architecture and wireframes. A separate UI designer completed the interface.
- What I did
- Turned a survey and stakeholder input into requirements for each stage of the applicant journey, benchmarked four institutions and flattened the site's structure.
- Outcome
- Requirements by journey stage, a flatter information architecture and annotated wireframes, handed to the UI designer.
What the survey said
I started with a stakeholder session, then surveyed prospective and recently enrolled students. Of the respondents, 54% were applying, 26% were in their first search and 20% were already enrolled. Degrees and curriculum, and cost, were the factors they chose most when picking a university. When I asked how easy each kind of information had been to find, the answers ranked like this, as percentages of those asked about each topic and rounded to whole numbers:
| Information | Easy | Neutral | Somewhat hard |
|---|---|---|---|
| Facilities | 62% | 15% | 23% |
| Each degree | 58% | 15% | 27% |
| Contact information | 50% | 12% | 39% |
| Total cost of the degree | 35% | 31% | 35% |
| Job opportunities after graduating | 31% | 35% | 35% |
| Scholarships | 27% | 39% | 35% |
The campus mattered too: 89% of those asked said knowing about the campus and its surroundings was important to their choice, and 78% said the same of the facilities. From the survey I built two personas, a 17-year-old aspiring STEM student and a parent who wants a prestigious school and an investment that pays off.
Where applicants get stuck
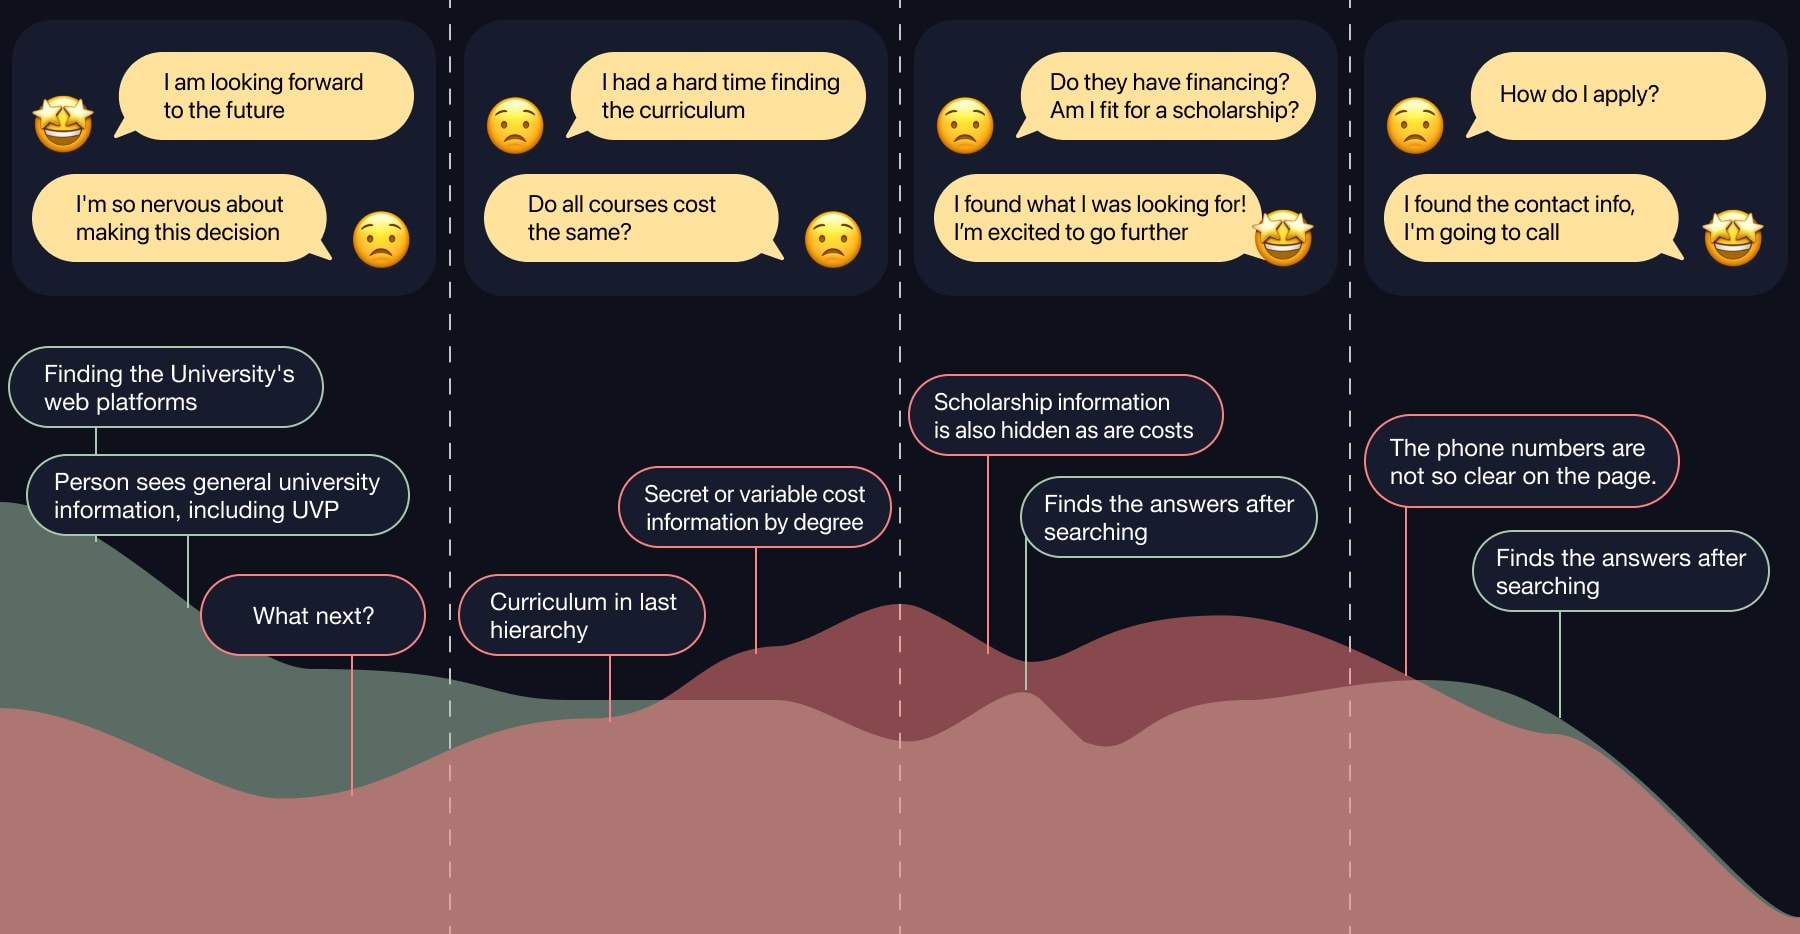
I wrote the user flows as a table, each row a user story: what the person wants, why, what they need to know and what gets in the way. Grouped by the four journey stages (initial search, career choice, finance and application), they became the requirements: calculate annual, semester and monthly costs; find scholarships that fit my profile; see where I am in the admission process. The experience map showed excitement at the start turning into anxiety as the journey went on, with one recommendation per stage.
A flatter site
I benchmarked four institutions the university picked: MIT, Hyper Island, ArtCenter and New Digital School, on 13 attributes. ArtCenter rated well on all 13 and became the model. MIT's direct language, "how to pay" instead of "payment", shaped the labels.
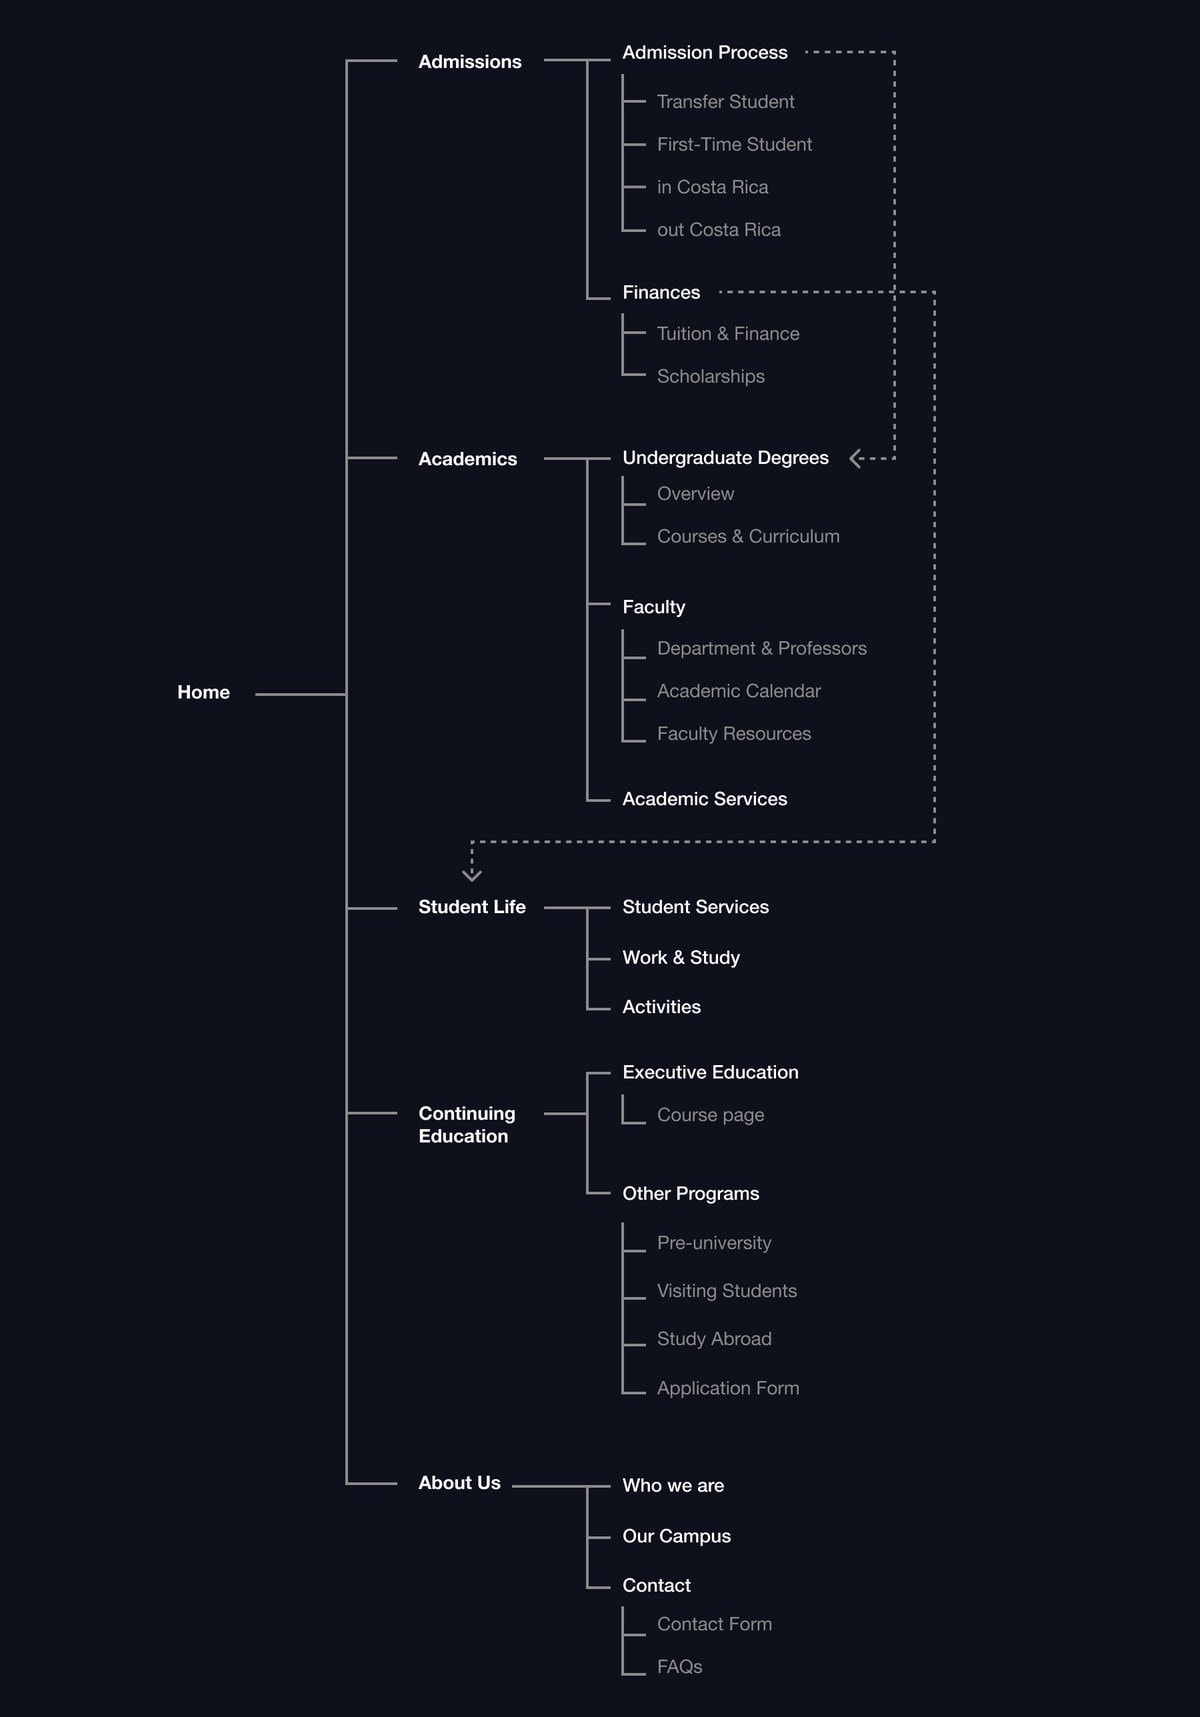
The university's guidelines required keeping its current menu items, so I skipped card sorting and took the architecture through stakeholder reviews instead, from an alpha to a beta, with one goal: fewer steps, fewer levels and the essential information at the first level. In the new structure, Admissions splits by applicant type, and tuition and scholarships sit inside it.
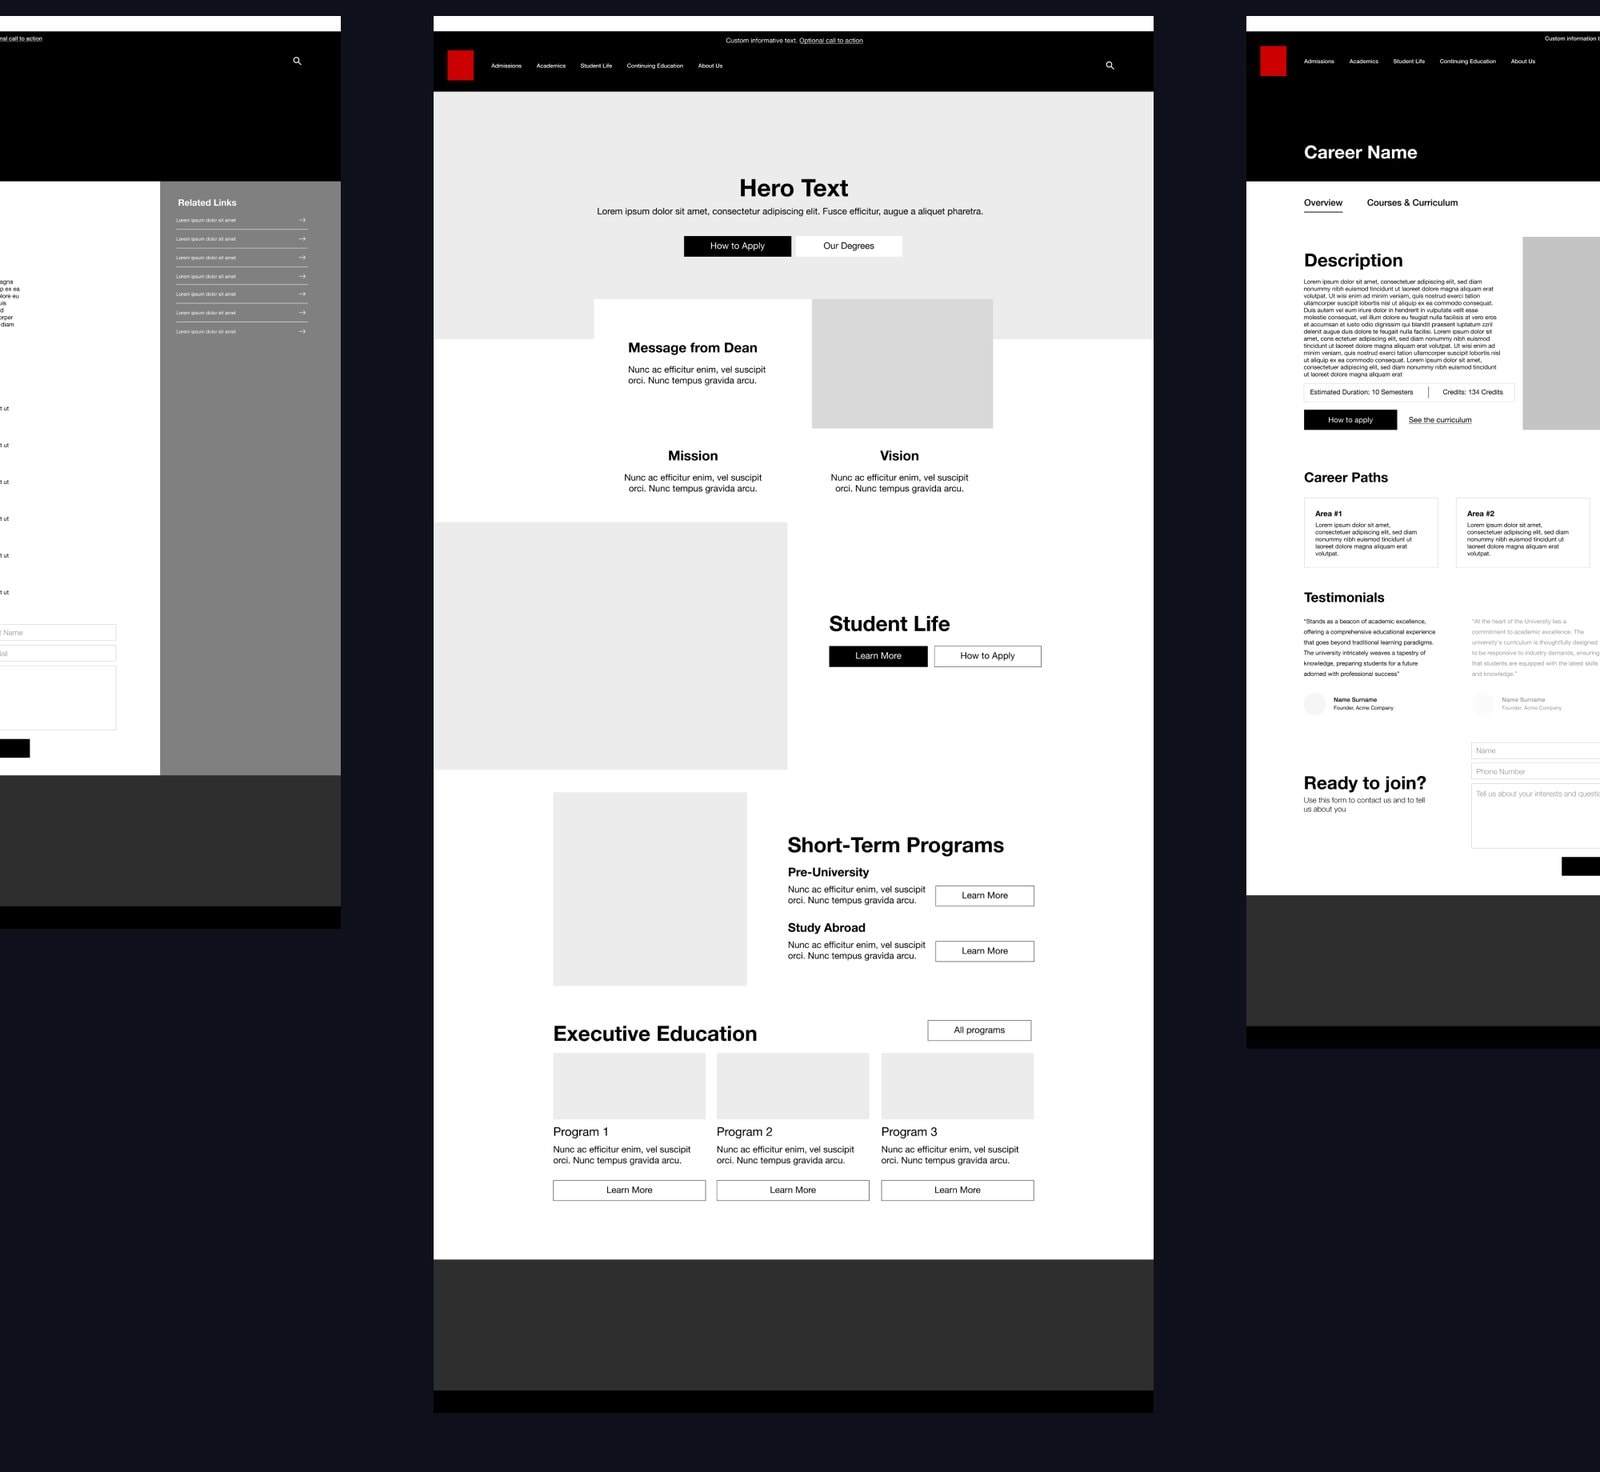
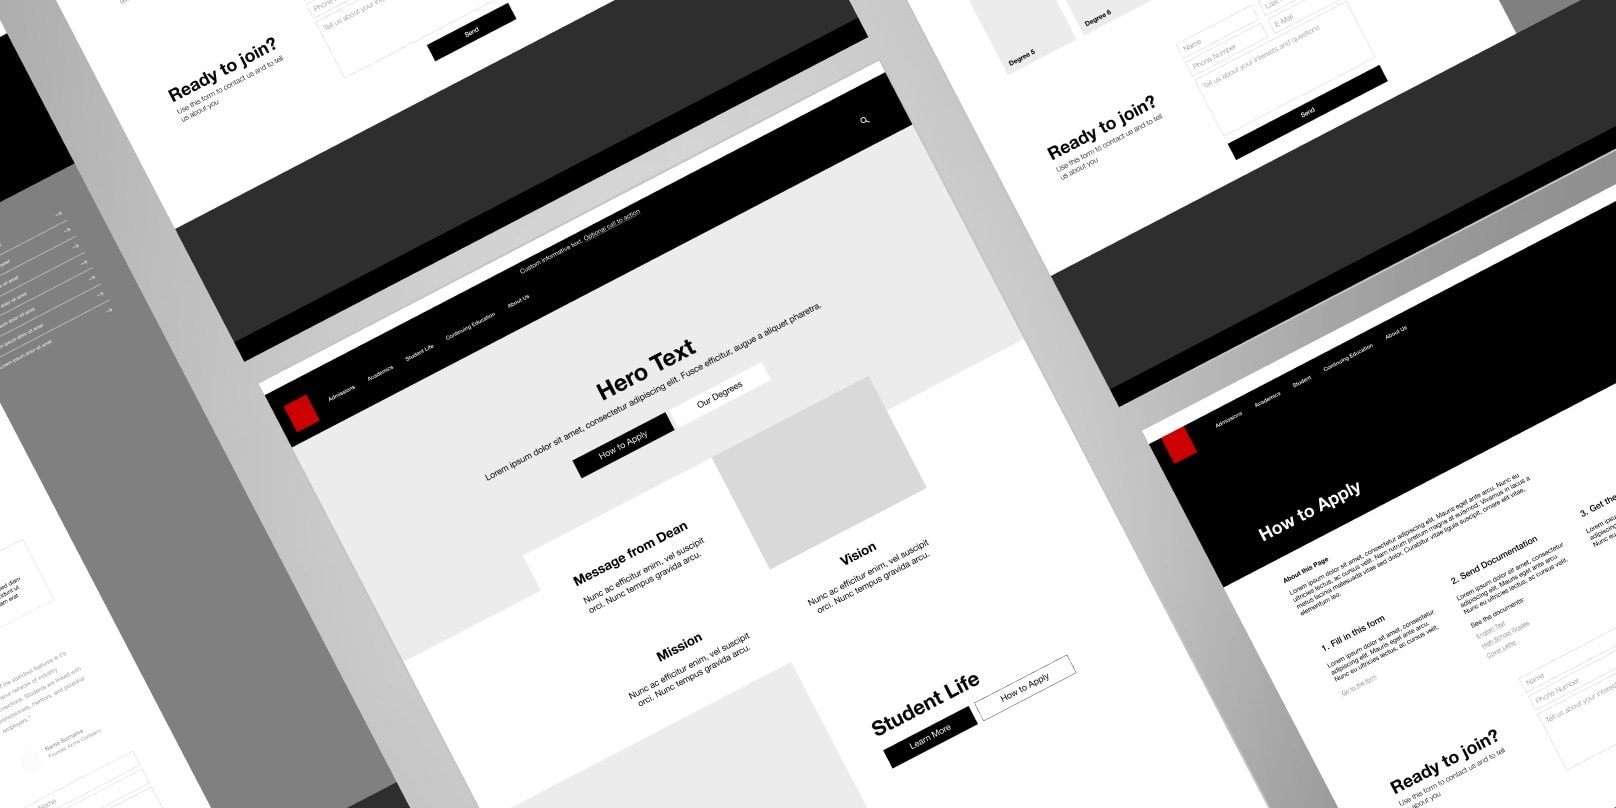
I wireframed the main scenarios (home, the degree catalog, a degree page with a semester-by-semester curriculum, the menu and a three-step admission process) and handed the annotated wireframes to the UI designer.
Results
27%
of those asked found scholarship information easy to find, the lowest of six topics
Job prospects (31%) and total cost (35%) were the next hardest
4
journey stages, each with its own requirements
Written as user stories, from the survey and the user flows
Client details are omitted or blurred for confidentiality.